Posted on 31 Aug 2023
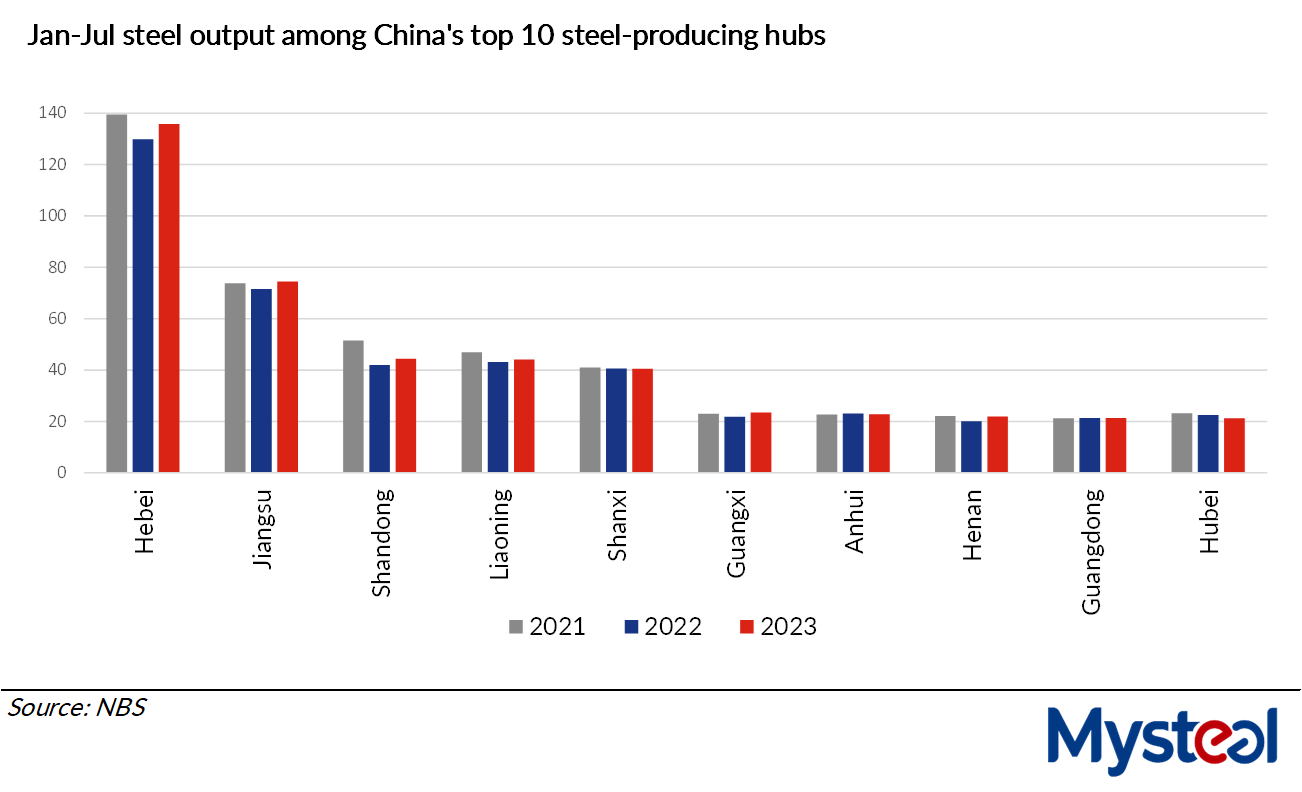
Six out of the top 10 steelmaking provinces and autonomous regions across China posted on-year increases in their crude steel production over January-July, according to the latest data released by the country's National Bureau of Statistics (NBS). The relatively low base in 2022 partly contributed to the on-year gains but so too did improved market fundamentals, Mysteel Global notes.
In July 2022, meagre profit margins on their finished steel prompted many Chinese steelmakers to conduct maintenance on their steelmaking facilities which caused their steel output to shrink, a Shanghai-based analyst pointed out.
For example, the profit ratio among the 247 blast furnace (BF) mills nationwide under Mysteel's tracking registered just 19.05% as of July 29 last year, according to Mysteel's survey.
Twelve months later however, most steel producers enjoyed higher profit margins and so were encouraged to ramp up their steel production, Mysteel Global understands.
On July 28 this year, the profit ratio among the 247 BF mills nationwide under Mysteel's tracking recorded 64.5%, soaring by 45.45 percentage points from the same period last year.
Meanwhile, capacity utilization among these mills also recovered by a sizable 10.52 percentage points on year to reach 89.82% during the same period, Mysteel's survey showed.
In fact, late last month domestic steel-market sentiment was improved by the central government's pledge to step up policy support for economic recovery, including optimization of policies to bolster the real estate sector.
Chinese finished steel prices continued strengthening in late July. For example, on July 27, the national price of HRB400E 20mm dia rebar, a bellwether of domestic steel-market sentiment under Mysteel's assessment, had risen for eight straight days to Yuan 3,897/tonne ($534.5/t) including the 13% VAT, the highest for nearly three months.
Table-1 Jan-Jul steel output among China's top 10 steel-producing hubs
Ranking | Province/Autonomous Region | Volume (mln t) | Y-o-Y (%) |
1 | Hebei | 135.76 | 4.53 |
2 | Jiangsu | 74.5 | 4.07 |
3 | Shandong | 44.48 | 5.94 |
4 | Liaoning | 44.19 | 2.29 |
5 | Shanxi | 40.54 | -0.23 |
6 | Guangxi | 23.46 | 7.67 |
7 | Anhui | 22.78 | -1.25 |
8 | Henan | 21.86 | 9.1 |
9 | Guangdong | 21.34 | -0.12 |
10 | Hubei | 21.22 | -5.62 |
Total |
| 450.13 | 3.05 |
Source: NBS
Table-2 July steel output among China's top 10 steel-producing hubs
Ranking | Province/Autonomous Region | Volume (mln t) | Y-o-Y (%) |
1 | Hebei | 19.52 | 4.81 |
2 | Jiangsu | 11.25 | 17.69 |
3 | Shandong | 6.66 | 21.51 |
4 | Shanxi | 6.03 | 23.32 |
5 | Liaoning | 5.66 | -2.57 |
6 | Guangxi | 3.59 | 25.4 |
7 | Anhui | 3.49 | 26.74 |
8 | Henan | 3.15 | 17.15 |
9 | Guangdong | 3.07 | 6.42 |
10 | Inner Mongolia | 2.83 | 33.23 |
Total |
| 65.25 | 11.4 |
Source: NBS
Source:Mysteel Global